Skip to main content
Visit the University of North Carolina at Charlotte homepage
Explore
Visit the University of North Carolina at Charlotte homepage
Close
What can we help you find?
Submit search query to search.charlotte.edu
Academics
Admissions
Campus Life
Research
Athletics
About
Apply
Visit
Give
News & Events
Directory
My UNC Charlotte
Quick Links
Majors & Minors
Graduate Programs
Calendar
Campus Maps
Class Registration
Financial Aid
Housing
Library
Report an Incident
Resources
Prospective Students
Alumni & Friends
Faculty & Staff
Current Students
Parents & Family
Colleges
Arts + Architecture
Business
Computing and Informatics
Education
Engineering
Graduate School
Health and Human Services
Honors College
Humanities & Earth and Social Sciences
Science
University College
University Center for Academic Excellence
Go to Search Page
Search this site
Search
Main Menu Toggle
About Us
Mission and Beliefs
Team Members
Quick Access Guide
UCAE Newsletters
Our Space
Campus Presentation Request
Starting the Semester Strong
Early Alerts
Midterm Grades
Exam Support Services
Partner Resources
Presentations & Publications
Academic Support Services
Tutoring
Peer Assisted Learning (PAL)
Academic Skill Workshops
Academic Consultations
Peer Coaching
Accountability Groups
SHIELD: Support for Students with ADHD or ADHD-like Experiences
49er Rebound
Join Our Team!
Graduate Teaching Assistant Positions
PAL Leader
Peer Mentor
Peer Tutor
Success Guide
Contact Us
Give Now
PAL by the Numbers
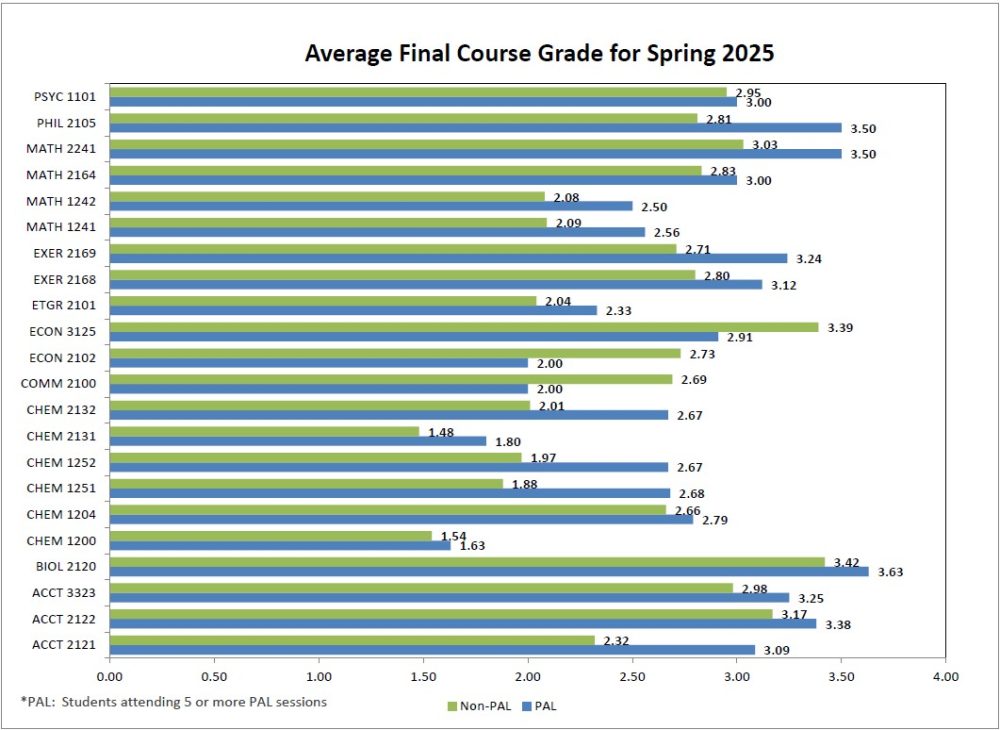
Spring 2025 Results
Course Based Grade Difference
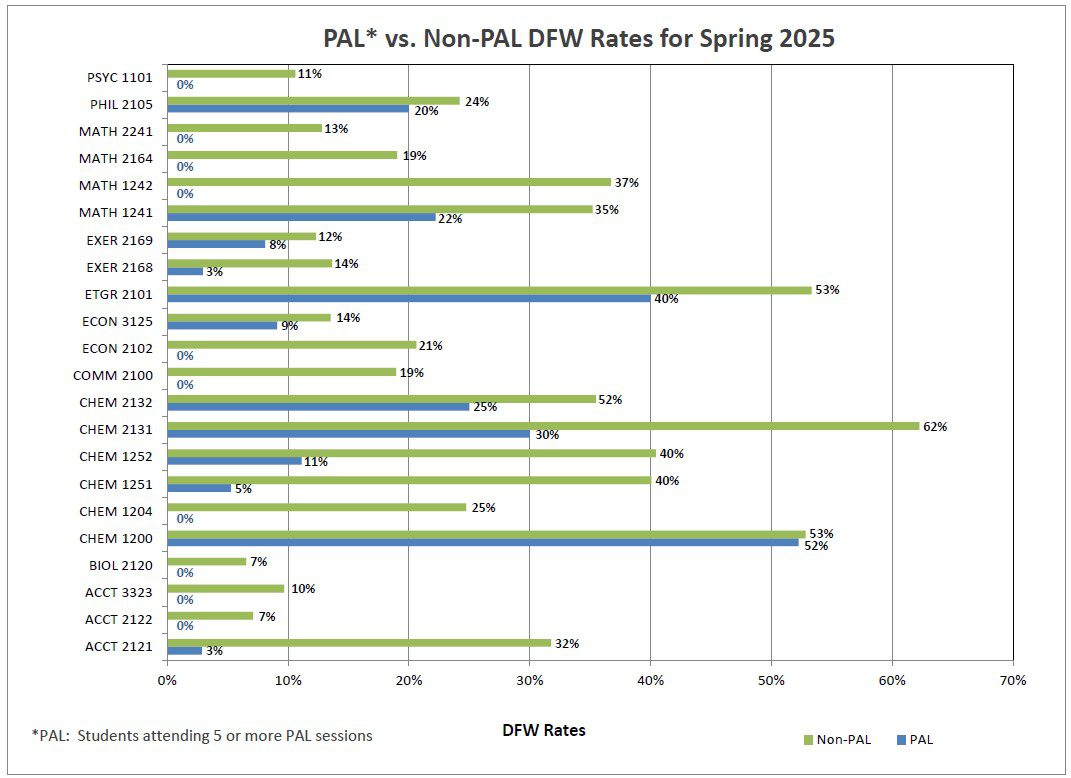
DFW Rates
DFW rates represent the percentage of students who made a D, F, or withdrew from the selected course. Measure is only for students attending 5 or more PAL sessions.
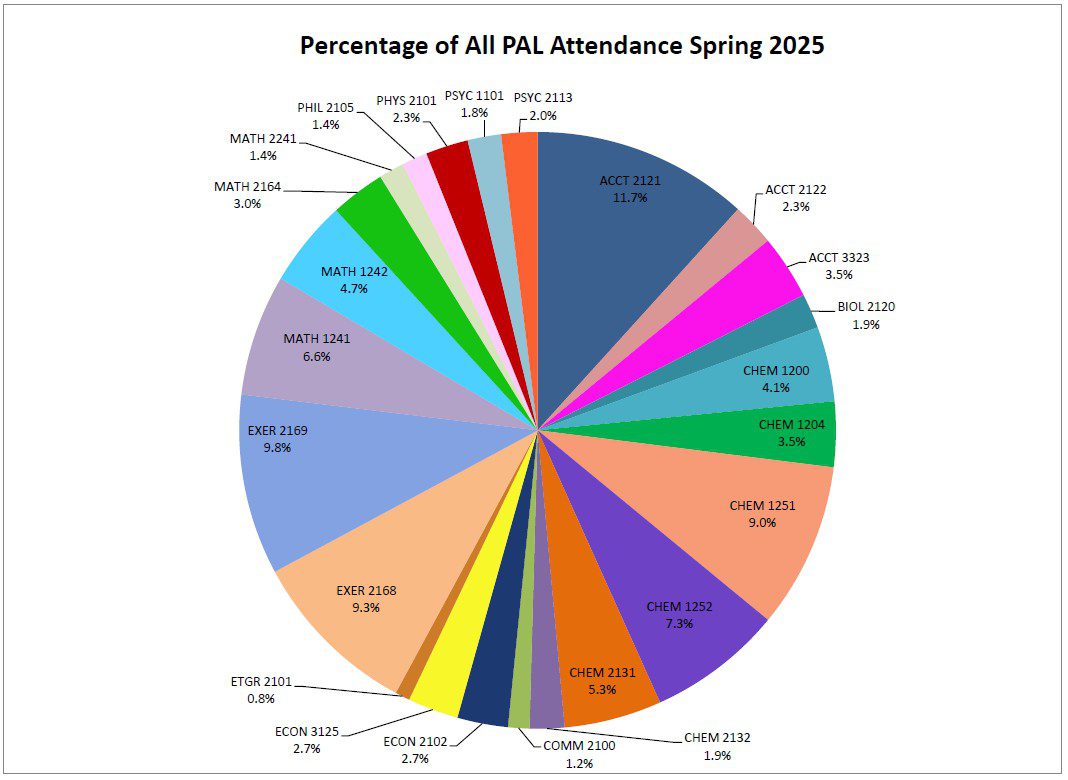
PAL Attendance Rates by Class
Percentage of sample, based on course, for a total PAL attendance
Contact Us